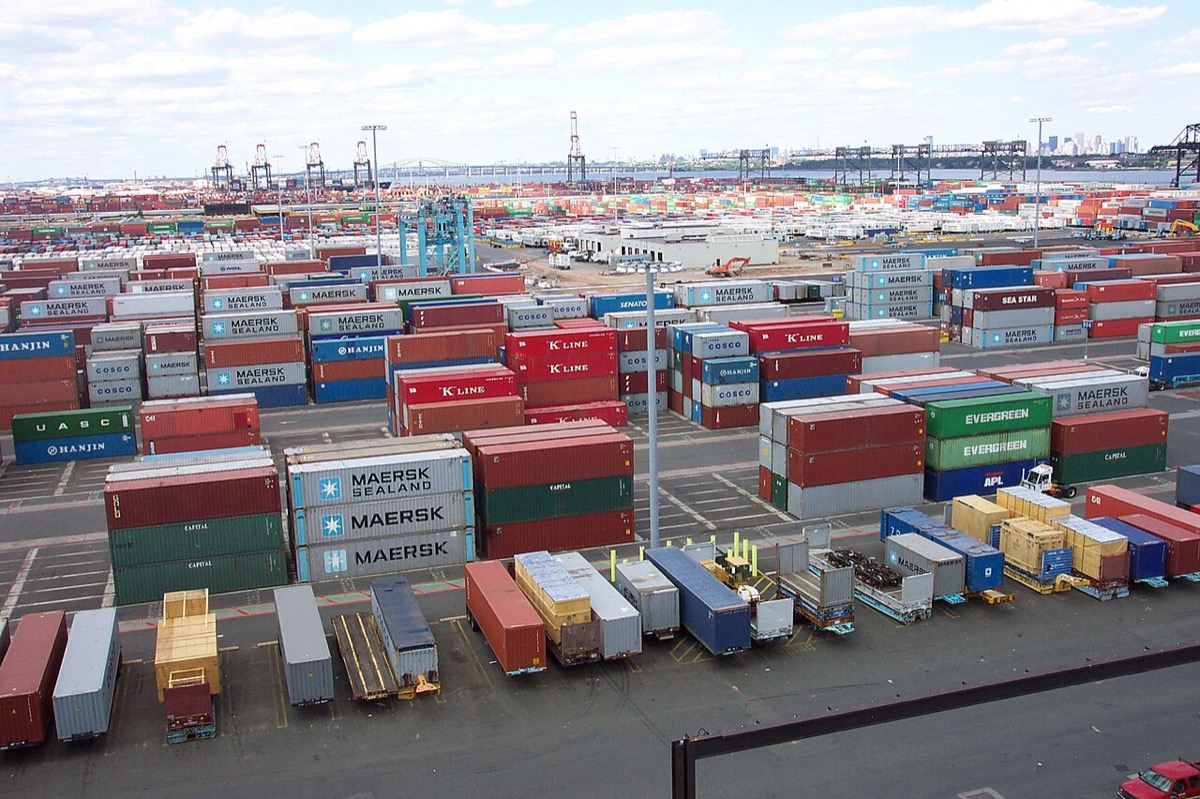
The General Administration of Customs of China dropped its March trade print yesterday, and the number surprised almost everyone on the sell side. Exports came in at USD 315.6 billion, up 14.8% year-on-year, the strongest monthly figure since the country fully reopened after zero-COVID. Imports ticked down 1.4%, which widened the trade surplus to USD 88.2 billion. For anyone who spent Q1 assuming Chinese export capacity was still bleeding and that FOB leverage had shifted to the buyer, this is the data point that says reassess.
We’ve spent the past 24 hours on the phone with suppliers in Ningbo, Qingdao, Dongying, and the Yangtze Delta chemical cluster, and the story on the ground lines up with the headline number. Capacity utilisation at the mid-tier specialty chemical plants is back above 85%. The big integrated producers, Wanhua, Sinopec, and the Jiangsu end of Formosa, are running closer to 92% on several key product lines. Order books are filling into August. Lead times that were 18 days in February are now 28 to 35 days on the same SKUs.
If you’ve got a mid-year FOB conversation coming up with a Chinese chemical supplier, the leverage has moved, and it’s moved away from you. This post walks through exactly what’s in the GACC print, why ASEAN’s surge matters more than the headline, which chemical categories have the least negotiating slack, and what to do this week to preserve your pricing before the suppliers realise fully what the market is telling them.
What Actually Showed Up in the March Print
The headline is USD 315.6 billion in exports, but the composition tells you more than the total. Exports to ASEAN jumped 35.4% year-on-year to USD 51.4 billion, which is genuinely remarkable and the single strongest regional print in the release. ASEAN is now comfortably China’s largest regional export destination, ahead of the EU and the US. Exports to the EU were up 3.4%, exports to the US were down 7.7%, and exports to Russia were up 136.4% off a low base.
On the commodity side, the releases most relevant to chemical importers showed:
| Category (HS chapter) | March 2023 exports USD bn | YoY change | Notes |
|---|---|---|---|
| HS 28 Inorganic chemicals | 4.12 | +8.2% | Soda ash and titanium dioxide strong |
| HS 29 Organic chemicals | 9.65 | +11.4% | Solvent and intermediates tight |
| HS 32 Tanning, dyeing, pigments | 3.21 | +6.9% | Downstream paint demand recovering |
| HS 38 Misc chemical products | 5.87 | +14.6% | Specialty blends leading |
| HS 39 Plastics and articles | 13.48 | +9.1% | Resin exports firming |
Organic chemicals and specialty blends are running noticeably hotter than inorganics. That matters because the organic and specialty categories are where you’ve typically had the most FOB negotiating room, and where Chinese suppliers have been most willing to cut per-MT prices to win US volume. That willingness is evaporating.
The other line that jumped out was the trade surplus at USD 88.2 billion for the month. That’s the widest monthly surplus since September 2022. A wide trade surplus tells you demand for Chinese product is outrunning Chinese demand for foreign product, which creates upward pressure on the yuan and, in turn, upward pressure on FOB prices expressed in dollars. The yuan strengthened roughly 0.6% against the dollar in the week after the print, which is small but directionally aligned.
Why ASEAN Matters More Than the Headline
Here’s the part most of the financial press missed. The 35.4% YoY surge in exports to ASEAN isn’t a one-off. It’s the continuation of a structural shift that’s been building since RCEP came into force in early 2022. Chinese chemical producers increasingly have a second, deep, close, price-tolerant buyer market that doesn’t care about USTR Section 301 tariffs and doesn’t require EPA TSCA compliance paperwork.
When a Ningbo plasticiser plant looks at its order book for Q3 and sees Indonesian, Vietnamese, Thai, and Malaysian demand firming at acceptable margins, the marginal US order becomes less essential to fill the capacity. The plant’s salesperson quotes you a firmer number on your next PO because they don’t need the volume the way they needed it six months ago. That’s the mechanism. It’s not that Chinese exporters love Southeast Asia more than they love you. It’s that they have more buyers competing for their output.
The practical implication for a US or Australian chemical importer is that your reference-price argument just got weaker. The classic move, quoting your supplier a Vietnamese or Thai landed FOB and threatening to source from there, works less well when that same supplier is already shipping into Vietnam and Thailand at comparable prices. Your leverage was built on the presumption that the Chinese supplier had excess capacity chasing your volume. That presumption is quietly breaking.

Which Product Categories Have the Tightest Slack Right Now
From our supplier conversations this week, the categories where Chinese producers have essentially zero appetite for further FOB concessions are:
- MDI and TDI polyurethane precursors, dominated by Wanhua Yantai. Wanhua’s order book is effectively full into late August. Spot MDI is quoted well above the contract grid, and Wanhua’s North America sales team is pushing back on any attempt to renegotiate Q3 contract prices downward.
- Solvents in the HS 2902 and HS 2909 range, particularly toluene, xylene, and the ether series. Sinopec’s Zhenhai and Maoming terminals are running at near-full utilisation on these products, and the FOB grid has firmed roughly 4 to 6% in the past 30 days.
- Titanium dioxide, HS 3206.11, from Henan and Sichuan producers. Downstream paint and coatings demand in Southeast Asia and the Middle East has absorbed what was softness in Q4, and Chinese TiO2 exports were up meaningfully in the March print.
- Specialty silicones under HS 3910, where Hubei and Jiangxi capacity is being routed preferentially to Japanese and Korean buyers who’ve historically paid a premium.
- Plasticisers in the HS 2917 range, especially DOTP and DEHP. Your leverage here was always thin because the market is concentrated, and it just got thinner.
Categories where there’s still measurable FOB slack include commodity inorganics like soda ash, caustic soda flake, and some of the basic acid salts, where Chinese capacity remains in modest overhang. If your product mix sits there, your negotiating position is not as bad as this post is making it sound. If you’re buying in any of the categories above, you need to be moving this week.
The FOB Math, Worked Through
Let’s say you’re buying 240 MT per month of an organic intermediate, call it an HS 2915 carboxylic acid derivative, at an FOB Shanghai of USD 2,180 per MT on a Q2 contract you signed in January. Your supplier just sent you a Q3 grid showing FOB USD 2,295. That’s a 5.3% bump. Your first instinct is to push back on the basis that global demand conditions haven’t materially changed.
Here’s what the GACC data tells you about whether that pushback will work.
| Factor | Q2 2023 position | Q3 2023 position |
|---|---|---|
| Supplier capacity utilisation | 78% estimate | 89% confirmed |
| Supplier lead time | 18 days | 32 days |
| Competing ASEAN buyer volume | Moderate | Strong |
| Yuan vs USD direction | Weakening | Firming |
| Supplier order book depth | 6 weeks | 11 weeks |
| Credible price-reference alternative | Vietnamese FOB 5% below | Vietnamese FOB aligned |
Every single row has moved against you. Your supplier knows this. The 5.3% increase is probably the opening position, not the ceiling. Accepting it now may actually be the best available outcome rather than holding out for a negotiation that produces a worse number in three weeks.
Run the landed cost through. At 240 MT per month at the Q2 FOB of USD 2,180, your monthly goods cost is USD 523,200. At Q3 FOB of USD 2,295, it’s USD 550,800. Delta is USD 27,600 per month, or USD 82,800 over the quarter. Add the currently active Section 301 List 3 duty at 25% on the incremental goods value and that extra USD 82,800 brings roughly USD 20,700 of additional duty exposure, for a quarterly landed cost delta of about USD 103,500.
That’s the number you need to be pricing into your customer conversations this month, not next month. If your customer contracts are indexed to a published benchmark like ICIS or Platts, the FOB move will flow through automatically. If they’re fixed price, you’re absorbing the delta, and you need to decide whether to take that hit or get a variation letter out to your customers now.

What the Leverage Shift Means for Mid-Year Orders
If you’d been planning to place your August and September orders in June at whatever the spot FOB looks like, reconsider. The GACC data is the clearest signal yet that Chinese chemical capacity is tightening into mid-year, and the typical pattern is that FOB prices lag the underlying capacity condition by four to six weeks. That means the soft quotes some suppliers are still sending out this month for July shipment will be gone by early May. The June spot you’re planning to book will almost certainly be worse than the April contract grid you’re looking at now.
Three practical moves worth running this week.
First, pull forward any orders you can justify on working capital grounds. If your customer demand visibility extends into Q3 and your balance sheet can carry an extra 30 to 45 days of inventory, placing the Q3 order against April contract terms rather than June spot could save 3 to 6% on FOB, which easily offsets the inventory carrying cost at current rates.
Second, lock multi-month pricing where suppliers will still offer it. A handful of the larger Chinese producers, particularly in the plasticiser and resin space, will still write a three-month fixed FOB if you commit a minimum volume. Those offers are disappearing, and the ones still on the table represent real value. The window closes within two to three weeks in our read.
Third, consider locking shipping now too. Ocean freight from Shanghai, Ningbo, and Qingdao to LA/Long Beach and Houston has been soft, but if Chinese export volume keeps printing at March’s pace, the freight softness resolves by midsummer. A booked slot at current rates is worth something.
The ASEAN Question for Your Sourcing Strategy
This GACC print is also a prompt to revisit your ASEAN sourcing diligence. If the structural story is that Chinese exporters increasingly have ASEAN as their primary regional customer, the other side of that coin is that ASEAN itself is becoming a more credible alternative supply origin for some product categories. Vietnamese, Malaysian, and Thai chemical capacity has been building for several years, and for a narrow band of intermediates and specialties the quality is now at parity with Chinese second-tier suppliers.
The candidates worth looking at first, based on our client work in the past year:
- HS 2915 and 2916 simple esters from Thai and Malaysian producers
- HS 3208 and 3209 coatings from Vietnamese and Indonesian producers
- HS 3402 surfactants from Malaysian and Singaporean producers
- Some HS 3824 specialty blends, with the caveat that TSCA inventory verification becomes more work
What we’d caution against is treating ASEAN as a one-for-one substitute for Chinese sourcing on complex intermediates. The technical support, the batch-to-batch consistency, and the regulatory documentation depth that you get from a top-tier Chinese supplier takes years to build elsewhere. Use ASEAN to diversify and to preserve negotiating leverage, not to wholesale migrate.
What To Do Between Now and the End of April
The GACC April print lands in mid-May. If that print confirms the March trend, the supplier-leverage conversation gets meaningfully harder, and any slack remaining in the April quotes you’re looking at now will be gone. You have a three- to four-week window where the information asymmetry is actually in your favour. Some suppliers haven’t yet fully internalised what the March data means for their pricing power. The ones who have, have already moved their grids. The ones who haven’t, still have April quotes out that reflect Q1 demand conditions.
Your next action: pull every active FOB quote you have on file, compare it against the current offer your supplier is making, and decide within the next 14 days whether to close the lower quote as a firm order or renegotiate. Don’t let quotes sit. Treat an unaccepted quote from six weeks ago as an expiring option, because in the current market, that’s exactly what it is.